08 Oct A Week of COVID-19
That there is a large disparity of experiences among those who contract COVID-19 has become well-accepted over the past several months since the pandemic started. Some individuals seem to experience no symptoms at all while others require hospitalization. Perhaps it is this ‘unknown’ element which has sparked so much paranoia and uncertainty. If everyone was confident the sickness would pass safely—albeit uncomfortably—over the course of several days, fear of contracting the virus might be replaced with an acceptance that eventually most will become infected. The last few months has shown us, however, that the severity of symptoms is not uniform. Some of our best athletes have required hospitalization after testing positive and many strong bodies have passed away from the virus.
Having contracted COVID-19 a few weeks ago and subsequently recovered (mostly), I thought it might helpful to take a few minutes to share my experience. As a fairly meticulous data-tracker, I have a few interesting charts to share which highlight the changes in my body as it began fighting the virus through to its recovery (again, mostly.)
The Onset
My first symptoms began to present on Monday, September 21, though I wasn’t aware of being sick until Wednesday the 23nd. These first symptoms were mostly muscular, and I initially assumed I was feeling the effects of a new weight training routine I had recently started. A look at my Heart Rate Variability and Resting Heart Rate for Monday and Tuesday show no causes for concern, but from a sensory standpoint I could tell my body didn’t feel right.
Upon waking on Wednesday the 23rd, the virus hit me like a freight train. My sleep that night had been horrible and I felt slightly lightheaded and ‘woozy’ alongside the muscular aches I had been feeling previously. My stomach was also slightly upset, but a trip to the restroom seemed to put that bit to rest. I had a cup of coffee thinking that maybe I was just tired and hit the road, setting out for a business trip to New Jersey.
Being in the car for a few hours gave me time to take stock of my body. Mentally, I felt ‘out of it’. I was fatigued and I noticed that my circulation didn’t seem ‘on-point’—my hands were and nose were a bit clammy. Recognizing that I was most certainly sick, I pointed my vehicle toward home and immediately scheduled a COVID-19 test for that afternoon. 24 hours later, the test came back “Positive for COVID-19.”
Symptoms
The symptoms and my experience over the following several days blended together somewhat, so I’ll refrain from laying out a chronology of symptoms. I also don’t believe it would be very insightful, as everyone seems to experience symptoms differently and at different times. Instead, I will explain how I felt ‘while sick’, which generally refers to Days 1 through 5. Beginning on Day 6 I felt definitively ‘on the mend.’
Fatigue and Soreness
Probably the most prominent symptom I felt while sick was a pervasive fatigue soreness of my muscles and skin. Throughout the sickness, the softer skin on my body—especially my abdomen below my chest and my shoulders—was sensitive to the touch. Shirts and the water from showers felt very ‘prickly’. My leg, shoulder, and abdominal muscles were especially sore during this time, and simple activities like walking up the stairs left me out of breath.
Taste & Smell
Loss of smell and taste did not happen immediately and for a day or two I thought I might avoid it all together. Unfortunately, but the evening of day 2, almost like a switch was flipped, I wasn’t able to taste anything. This was a very strange sensation, and I’m curious what kind of neurological effect the virus has on the body that would cause something like this. My guess is that it might be related to the skin sensitivity.
Fever
My body ‘fevered’ on and off for the first 3-4 days, especially at night while sleeping. From the beginning, I could tell that my body’s ability to thermoregulate was degraded but I didn’t have pervasive fever until the evening of the first night. It would come and go, but I generally tried to ‘yield’ to the fever for this illness. I slept with a shirt on at night, something I usually don’t do, and generally tried to assist the fever. For whatever reason, it felt like the thing to do in this situation.
I did not take regular calibrated body temperature readings (though I do have daily temperature fluctuations from my Oura ring, outlined below), but my temperature at the testing clinic was 100.6 F. I assume that I had elevated temperatures in that range for about 4 days which, corroborated by the temperature data below.
Gastro/Digestive
I mentioned that one of my first symptoms on Day 1 was gastro discomfort, however this was very short-lived, and ‘digestive operations’ continued in a normal, ‘regular’ fashion for the duration of my sickness.
What did I eat while sick? Well, I quickly transitioned from a near-Ketogenic diet (very low carbohydrates) to about 25-35% carbohydrate diet. I did this because I felt my body needed this type of simple energy and it was very simple on my stomach. (Carbs for me consisted of: a few pretzels, some hummus, some crackers, kombucha, and a little bit of ice cream in the evening;) ) My appetite was rather diminished while sick, especially with no help from my lack of taste and smell.
It was only near the end of my sickness and at the beginning of the ‘recovery period’ that I did feel ‘uneasy in the stomach’ at times. I hesitate to use the word ‘queazy’, because I certainly wasn’t nauseous. I simply felt a bit ‘off’ after eating certain complex foods (like eggs). This may have been a muted symptom for me, but I can imagine that others may experience more intense nausea while sick with COVID-19.
Lungs
Pulmonary function was one of my biggest concerns surrounding COVID-19. Often referred to as a ‘respiratory virus’, I’ve heard scary stories of healthy individuals have severely damaged lungs, and of course one of the biggest fears from a public health perspective is hospitals’ inventories (or lack of) respirators and CPAP machines.
A regular meditator, I do breathing exercises almost daily, so I tried to be very aware of my lungs from the outset. During my sickness I didn’t perceived a even a slight impact to my lungs. My lung capacity seemed normal and I perceived no fluid accumulation. Yes, I would get out of breath after physical movement, but I did not perceive this as a pulmonary thing. No coughing or wheezing.
There is one exception to all of this. Near the end of my recovery period, after I had already begun light physical exercise (Zone 2 & 3/~115-150BPM) I felt some ‘tiredness’ at the extremities of my lungs. The best way to describe it is that it almost felt like light exercise-induced asthma. It was only noticeable when taking deep, deliberate breaths and it didn’t affect normal activity (though I did push my luck.) The sensation passed after 3-4 days. Whether this was an effect of the virus or simply due to me recommencing exercise too quickly after recovering, I’m not sure.
Metrics
Ok, now onto the fun stuff!
A few notes: The three programs I use daily to track these metrics are: Oura Ring (device and app), HRV4Training (app), and Withings Health Mate (Smart Scale and app.) With few exceptions, I take these measurements every. day. with meticulous variable constraints. For instance, I only weigh myself immediately upon waking, before drinking anything, after ‘going number 1’ but before and ‘number 2’s’. It goes without saying that these are non-clinical measurements, but they are at least done with a degree of intentionality that should give them some measure of meaningfulness.
Resting Heart Rate
Earlier in the week, before exhibiting symptoms, you can see two Resting HR spikes—these are from drinking. Believe it or not, even one or two drinks before bed increases most people’s resting HR significantly. Importantly, those spokes do not drastically affect my baseline Resting HR, which cruises around the 50 BPM range.
The morning I woke with symptoms, my HR bumped up to 58 BPM without having had any alcohol the night before. Watching my baseline over the following week, my average Resting Heart Rate jumped up to nearly 56 BPM, translating to a 12% rise over my healthy baseline. (The first night of my sickness saw a RHR of 65! 😱)
![]()
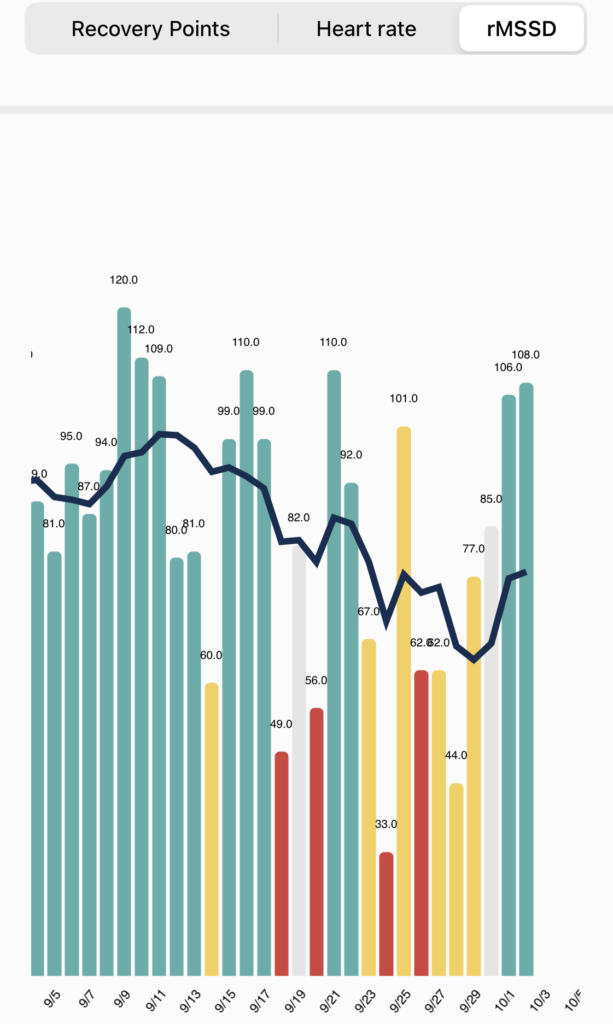
Heart Rate Variability
For those who aren’t familiar with Heart Rate Variability (HRV), HRV is a cardiovascular measurement of the variance between heart beats that sheds insight into the status of the nervous system (and by extension, the body as a whole.) When the body is in a healthy, recovered state, HRV will be high, meaning it is highly responsive to sympathetic and parasympathetic demands. When your body (and/or mind) is super stressed, HRV will be low, reflecting your bodies difficulty in responding to those physical or psychological demands.
Looking at my HRV casts an even starker picture of COVID’s effects on my body—my HRV takes a deep dive. Interestingly, you can see that my baseline HRV (which is usually pegged around 90-95) begins to slowly descend several days before my symptoms manifested. Then, on Wednesday the 23rd, I hit a cliff down to 67 rMSSD. And then 33 rMSSD. Some background: 33 rMSSD is the lowest HRV score I’ve EVER registered in the 2+ years I’ve been tracking my HRV. This is INSANELY low.
What’s more, I was actually in bed for 12 hours that night and slept for 9.5 hours (see following screenshot.) So even though I was giving my body maximum time and space to take care of itself, it was still really struggling that night.
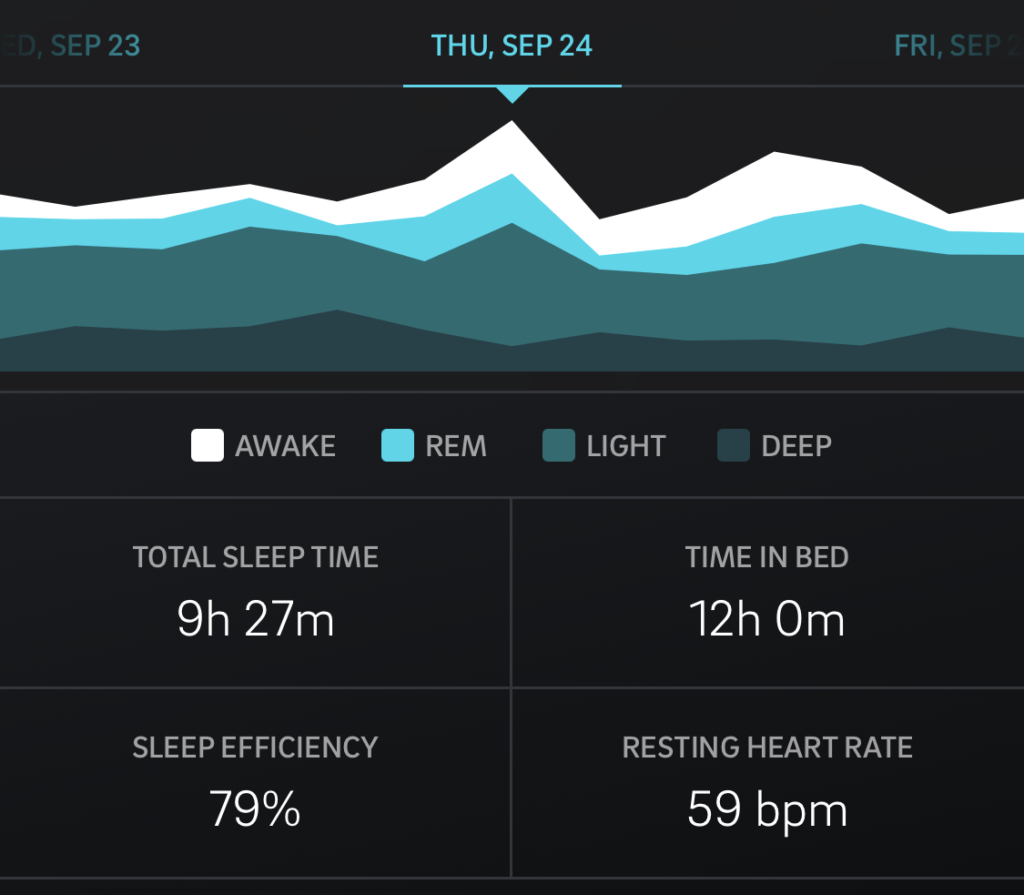
My HRV remained low for several days before gradually climbing back to normal levels. You can see near the end that my baseline is tracking up.
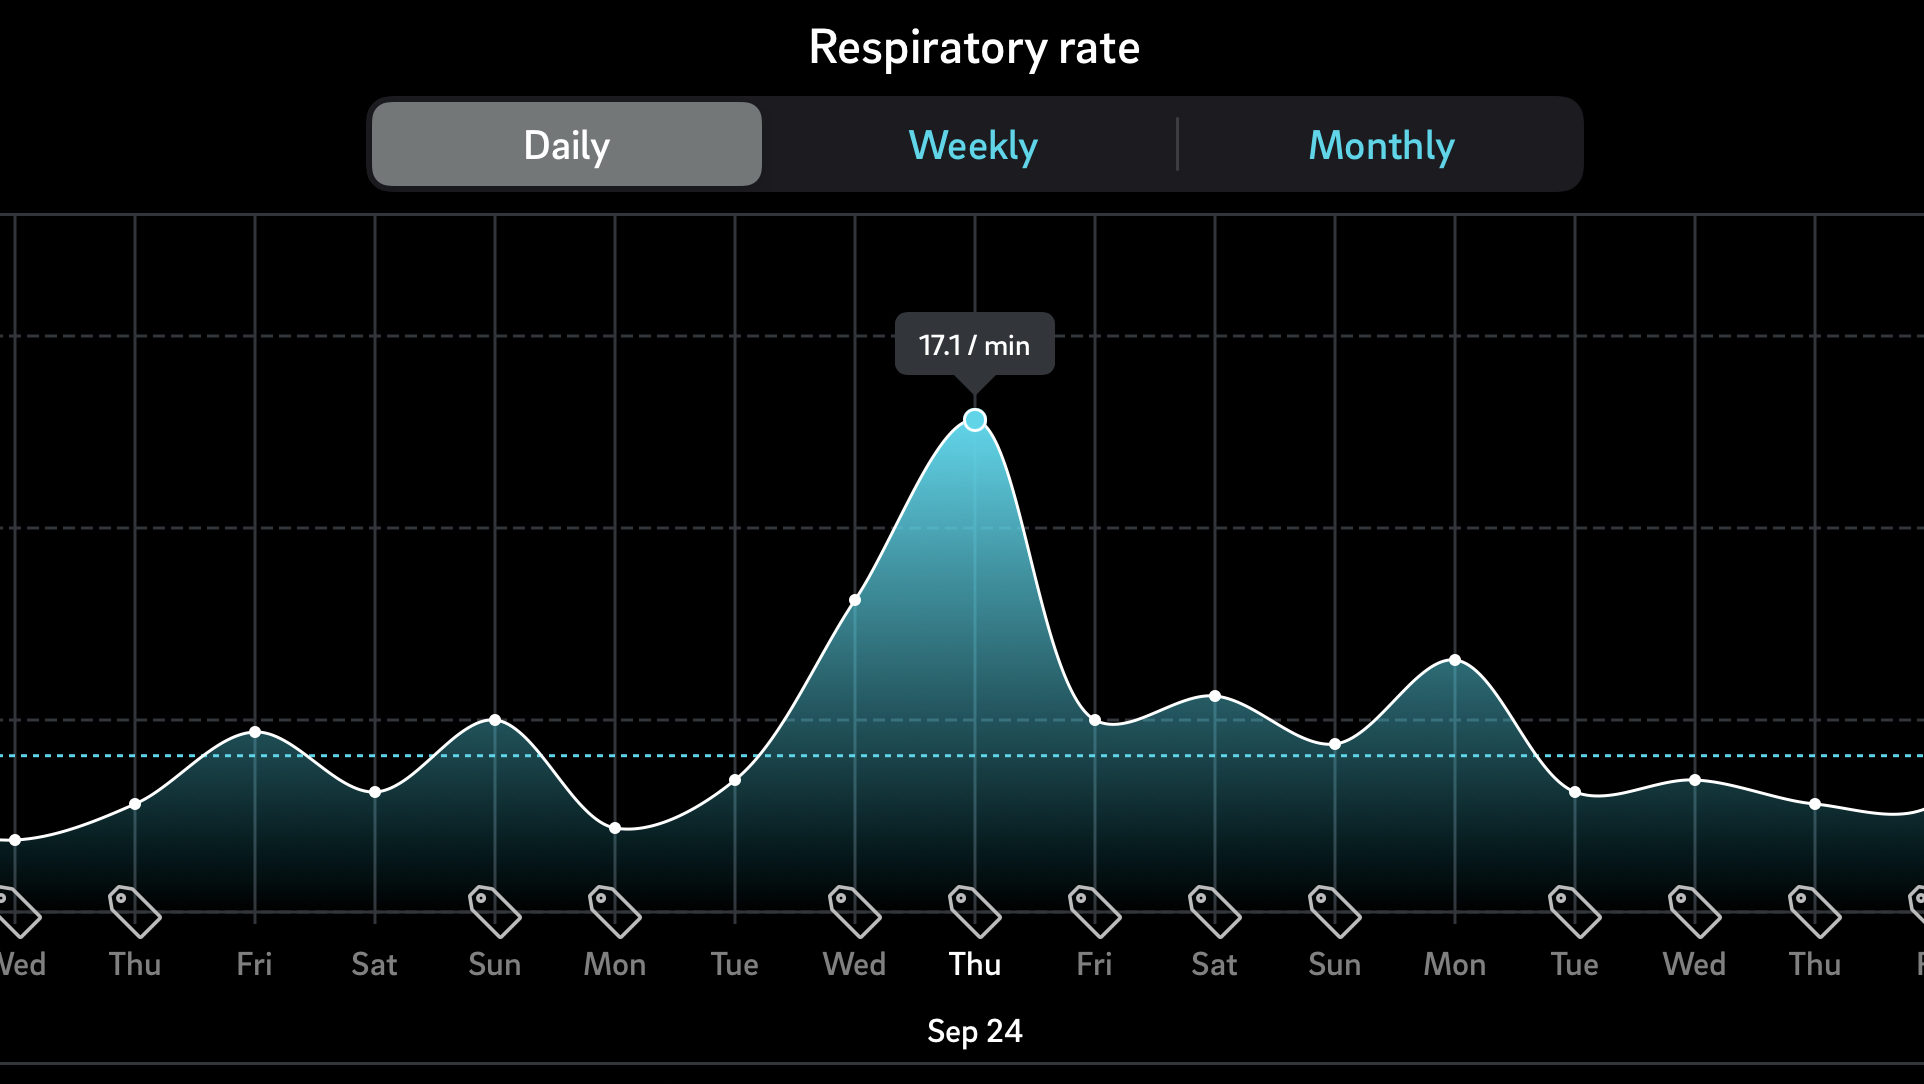
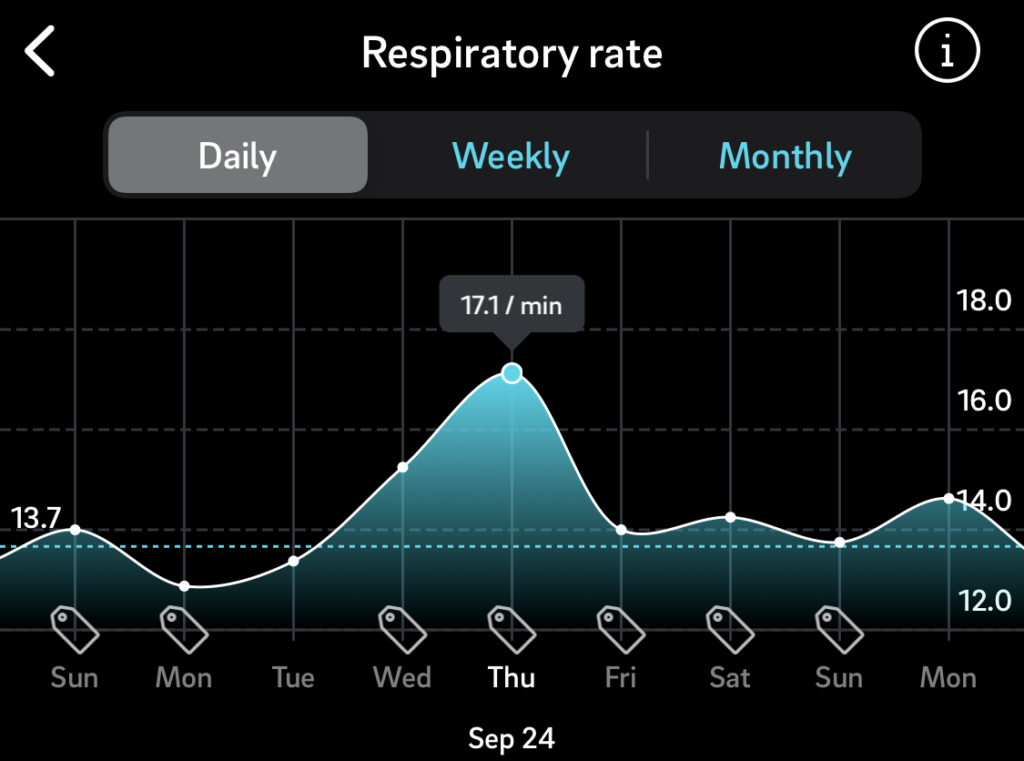
Respiratory Rate
Honestly, I don’t have a lot to say about my respiratory rate readings. I would love input on this from anyone who may have experience interpreting this metric.
I’ve provided the best chart I could create but I wish I could show a longer time series just to show how much that respiratory rate spike deviates from my average. Based on my last 4 months of data, my standard deviation (SD) for respiration rate is approximately 0.4 / min. During my illness, my respiration rate blew past that SD and hung out around 1.0/min above baseline, and for the first two days, I was nearly 3.5/min higher than baseline. That’s a 26% increase in respiratory rate!
Recall above: I didn’t feel as though my lungs weren’t working well, I just felt like I would lose my breath very quickly while just moving around my house.
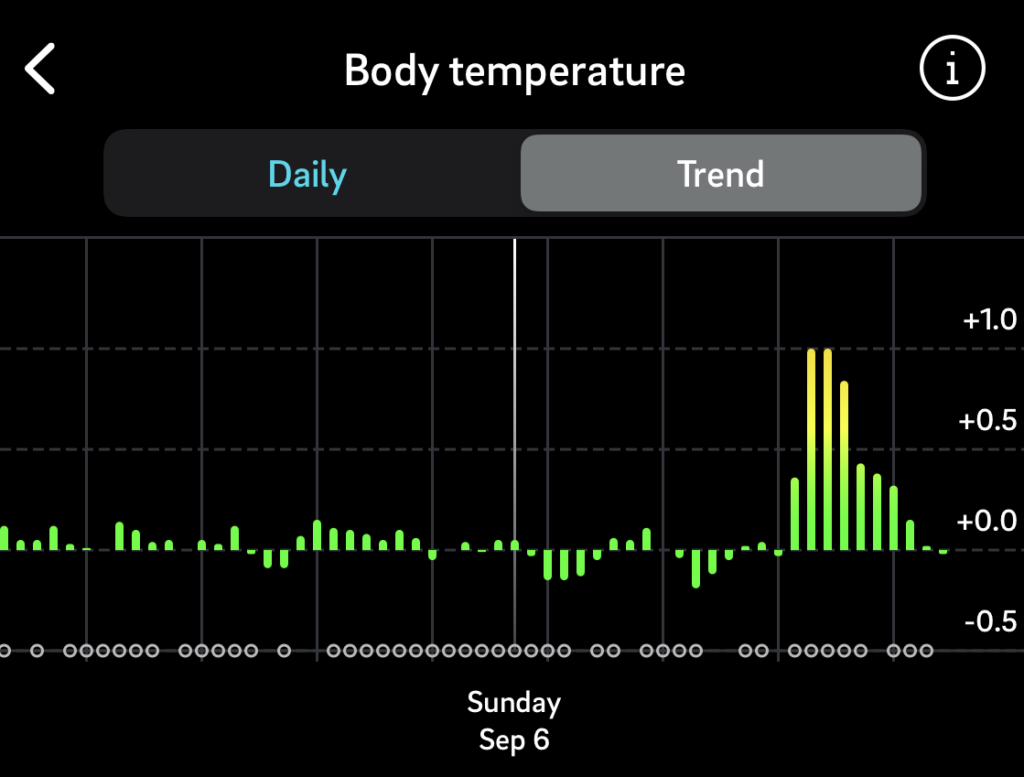
Average Body Temperature
Here’s an interesting one!
As mentioned above, Oura Ring does not take ‘degree temperature readings’, instead it measures your deviation from baseline. As you can see, my standard deviation is roughly 0.1 to 0.2 — very minimal. While fighting COVID-19 my temperature was significantly higher than average.
What is interesting is that even as some of my other metrics began to improve—Resting Heart Rate for instance—my body was clearly still feverish, exhibiting temperatures 2-3 deg F higher than baseline.
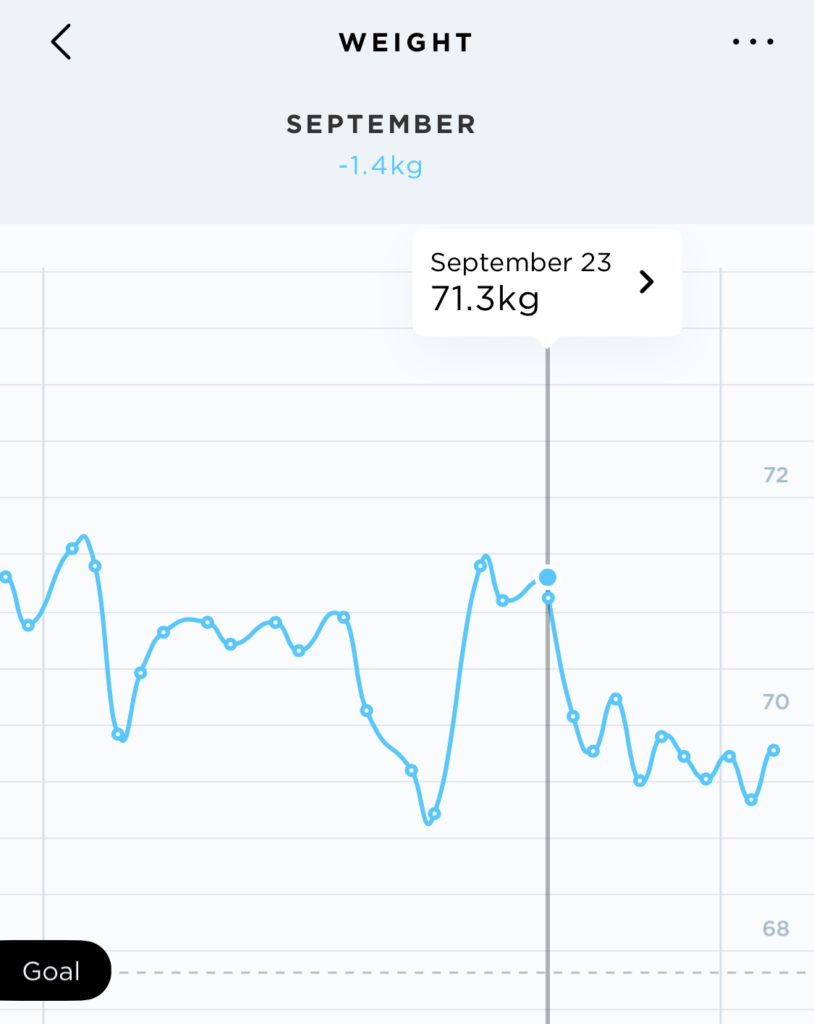
Weight
Again, not a doctor, I’m just sharing this as an anecdote.
Presently, my ‘meta trend’ is that I’m losing weight, so I don’t want to mislead you into thinking that COVID caused my weight to drop. However, I do attribute that rapid drop to my lack of appetite while sick.
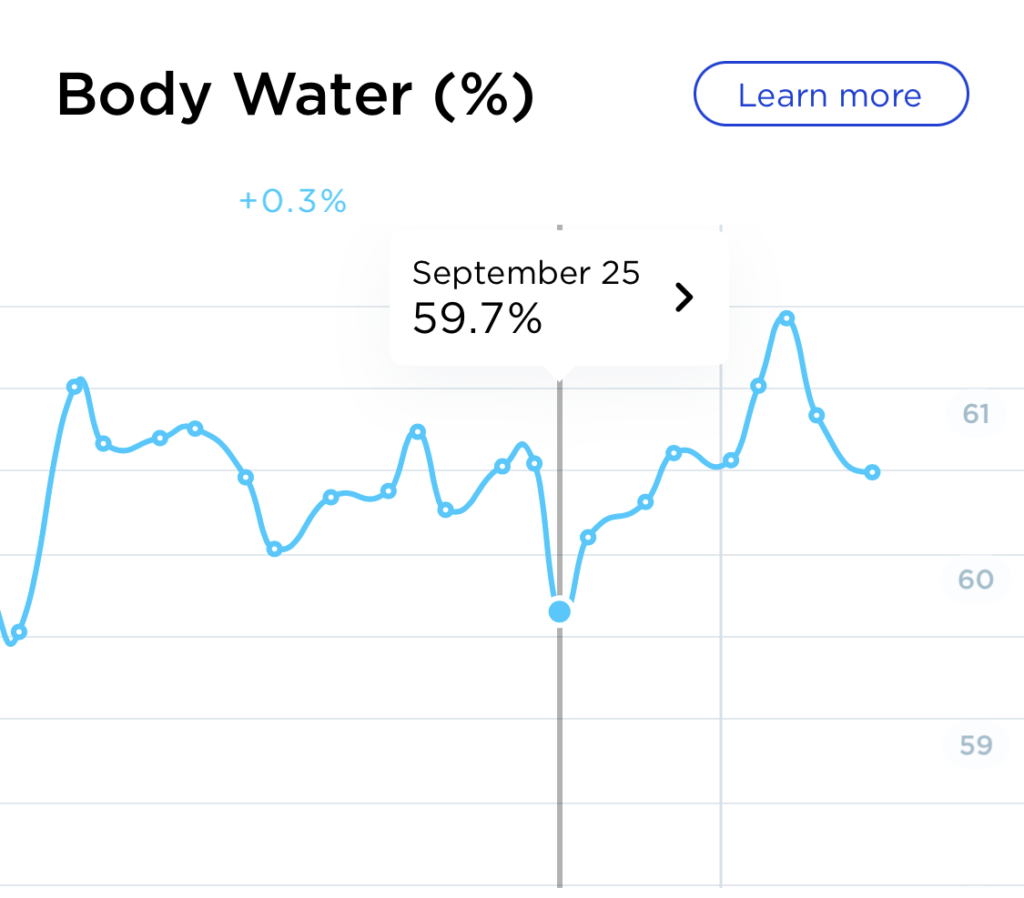
Also of note, my Body Water % dropped and my Body Fat % increased during my sickness, which I have noted while being sick in years past. I believe this is because of some hormonal response to fighting the virus (like an inflammatory response.) I haven’t studied this too much, however (I prefer to not be sick, so I’m usually studying areas of health that don’t pertain to being sick😉)
Recovery
My recovery from COVID was much longer than I’m used to. Usually when getting over a sickness my symptoms seem to drop off rather quickly. Typically there is a day when I wake up and simply ‘feel better’—95% health or more.
With this sickness, my symptoms slowly diminished. By Day 5 or 6 I was beginning to regain taste and smell, but gradually. Salts and sugars were the first to return, then some of the more complex ‘flavors’ slowly came back (like whiskey, mushrooms, roast-y-ness, coffee, etc.)
Overall, my recovery ‘phase’ was more about ‘body rebuilding’ than ‘virus-defeating’. By day 5 or 6 it was clear that my body had conquered the virus and the war was basically over. My body, however, was very tired, inflamed, and in need of repair. While I did slowly return to jogging and light weight lifting, I generally babied myself. No cold showers, more carbohydrates than normal, plenty of sleep, no alcohol, etc. This seemed to work pretty well.
By day 9, I felt 90% healthy.
Transmission Chain
Probably the first questions people ask my is “Where did you get it?!” The transmission chain in my case was very cut and dry—easily traceable. Without betraying privacy, what I can say I that was infected by someone who I am not ‘physical with’ but with whom I spend a lot of time with. This individual was infected by a romantic partner, who was infected by a friend after a weekend trip spent together.
I have pointed out lately that in this situation it is clear that the virus didn’t spread ‘casually’. No one in this transmission chain simply got COVID-19 from the grocery store, or from opening a pizza box from Dominos. Every step along the chain involved close, extended, personal contact. This is not to say that it cannot or does not commonly spread in ‘open air’, however that was not a feature in this transmission chain.
Wrapping Up
Most readers will not have read to this point and I apologize for being long-winded. My hope is that the reader may have skimmed this article to find sections relevant to their interest. Again, this is not a clinical or scientific recap. As with any subjective experience, these words are subject to my human memory and my capacity to explain ‘feelings’. Take it with a grain of salt.
I’d love to further discuss my COVID-19 experience if you believe it may give you some value—feel free to shoot me an email!
Some things to check out:
Oura Ring: I’ve been using the Oura Ring for about 6 months and I absolutely love it. It tracks dozens of biometrics, is barely noticeable while wearing, and doesn’t require a subscription. They cost around $299.
HRV4Training: This app allows the user to easily tag days and measurements which allows for ‘correlation reports.’ For example: “How much does alcohol affect my resting heart rate?” It does have an up-front cost (maybe $10), but is well worth it. Especially if you are an athlete, you should be using this app.
Withings Smart Scale: This scale is a no-brainer. In my opinion it is best-in-class. It’s completely automatic–I step on the scale every morning and then forget about it–and has a great accompanying smartphone app. Whenever I actually want to analyze my data I simply open the app and there it is!
Thanks for the very well-written write up!
Posted at 20:54h, 08 October👍
Ken Rundell
Posted at 07:59h, 09 OctoberVery interesting and good job in tracking. Thanks for taking the time to write this.
Aaron McNany
Posted at 13:57h, 12 OctoberThanks, Ken! Never know when the data will be meaningful so consistency is the key! 🙂
Jean-Marc
Posted at 18:38h, 09 OctoberThanks very appreciated, great info. My rMSSD is always the first indicator that something is coming.
Aaron McNany
Posted at 13:59h, 12 OctoberMy rMSSD is always very responsive to alcohol consumption but I’ve noticed that it does have some ‘lag time’ when it comes to my immune system. I was surprised to see that the two days before onset, my rMSSD was just fine! This is probably because my inflammatory response hadn’t been ‘activated’ yet despite the virus being present in my system.
Very impactful, however, to see such a low HRV in the midst of the virus–scary!
Gail
Posted at 19:56h, 09 OctoberReally interesting! Thank you for taking time to put it together. I wonder if others out there have similar data to share by comparison
Aaron McNany
Posted at 14:03h, 12 OctoberThank you! I was glad that I have been tracking the data. Of interest: Oura Ring have partnered with a research organization and have been taking voluntary surveys of Oura Ring users to help correlate biometric data with verified positive test results. I’m sure there will be some interesting observations when they aggregate all of their users’ data and compare with Covid test results!
Patrick Rudaz
Posted at 11:01h, 10 OctoberThank you for sharing. Read it all ;). I use the same tools as you to measure key metrics. I’ll share my data when I get infected. Been close (my son got it). I recently had a week where my RHR was 12% above normal and was feeling tired so took the whole week off training. My rMSSD was also super low for a couple of days (36). I’ve recently separated and am still settling into my new routine. I put it down to that although onset of Covid or other illness seemed more likely. I did feel weird and sounded rough in the mornings for about a week, but that was all. I returned to regular training a couple of weeks ago and both RHR and HRV are normalising.
Aaron McNany
Posted at 14:26h, 12 OctoberHave you had the antibody test or did you get tested while experiencing those symptoms? Those RHR and HVR numbers are almost exactly like my COVID experience. (I also have had some pretty significant ‘personal stressors’ in my life in the past several months and I’ve noticed that when under significant external stress, my HRV is much more affected than my RHR. If you have a longer-term increase in RHR, I’m inclined to suspect an illness.)
Those close to me who also tested positive (all family) did not experience symptoms the way I did. My daughter, for instance, only had a headache and runny nose.
Patrick Rudaz
Posted at 10:00h, 14 OctoberHi Aaron,
Thank you for your reply. No, not had it this time round (I have had the test before but tested negative). My son tested positive though and he was recently sick with it. I was obviously very exposed, but I seem to have been ok thus far, apart from these numbers that I track. I trained today and feel ok, we’ll see…
Aaron McNany
Posted at 12:56h, 14 OctoberWell good luck–best case scenario, you don’t get the virus!
Mark
Posted at 05:33h, 11 OctoberI had not been tracking my HRV for a while, and THIS is exactly why I started again. HRV has always been a reliable indicator of illness for me. Good times for that kind of insight.
Aaron McNany
Posted at 14:28h, 12 OctoberYou never know when it will come in handy! The key for me has been coming up with a routine that I can maintain 95% of the time. There was a period a few years ago when I was doing 3 minute HR/HRV readings EVERY MORNING, and it was just too time consuming. My process now is much more automatic and passive.
Dima
Posted at 11:28h, 14 OctoberHow did you automate the HRV reading?
Aaron McNany
Posted at 13:02h, 14 OctoberI use Oura Ring (https://ouraring.com/). I wear the device every day all day (it only requires charging for about 25 minutes/week.)
There are some problems with this, however. The Oura Ring provides HRV based on the average HRV while sleeping. Of course during sleep, one’s HRV will fluctuate. Theoretically HRV will be higher near the end of the sleep cycle than the beginning. Probably the best method (as Marco Altini writes here: https://www.hrv4training.com/blog/oura-ring-integration-read-sleep-data-whole-night-heart-rate-and-hrv-in-hrv4training) is most likely from a SINGLE reading immediately upon waking. I have done this for long stretches before, but there is some overhead constraints in this method, namely, the time and discipline required to do the test every morning.
My belief is that as long as the readings are consistent, I’ll have meaningful data. It may not be scientific-grade data, but it’s meaningful.
Patrick Celka
Posted at 04:58h, 22 OctoberHello Aaron, I believe that you have picked up the most important point in all these self-monitoring systems: 1) regularity, 2) consistency and 3) ease of use. Oura specializes in sleep so the analysis is really focused on this time of day. Using Oura outside this frame might not be as reliable. Just good to keep in mind. Also, best time to measure our health is at wakeup. Even 1-2 min at full rest is sufficient.
Pat
Dick Chartier
Posted at 09:28h, 14 OctoberThank you for your thorough review. The two low HRVs on 18th and 20th: is this a normal response after drinking(like your RHR)? Could this of been an early warning of infection? Or do you attribute other known stressors?
Aaron McNany
Posted at 13:05h, 14 OctoberThank you! These rMSSD values (on the 18th and 20th) are consistent with alcohol consumption for me. Looking at my lifestyle tags, I can see that I did have “some alcohol” the nights preceding those measurements. Also, I don’t believe I came in contact with the virus until the 19th or 20th, so I don’t think my body would have indicated immuno-response so quickly (I’m not a doctor, though.)
Austin F Hildreth
Posted at 13:55h, 14 OctoberGreat documentation and I am glad to hear I am not the only person out there tracking so much data about myself.
Tomas
Posted at 15:14h, 14 OctoberI appreciate daily RHR, HRV readings and I take the daily measurements too. It’s another feedback for recovery, readiness to training. I actually don’t understand how one can say “HRV is early indicator of sickness”. We can see from yours example and I can see on my measurements too, that HRV falls (RHR rises) on the day we already felt symptoms, not day or 2 before.
Aaron McNany
Posted at 16:04h, 14 OctoberI completely agree. Looking at other times that I have been sick in the past, my HRV doesn’t decrease until onset of symptoms. (I wonder if this is documented somewhere on a clinical level?)
On a different note, I AM suspicious of weight fluctuations pre-symptoms. I haven’t correlated it enough with sickness to have any meaningful interpretations right now, but I believe I have noticed an increase in body weight and body ‘water %’ in the day or two before symptoms show. I have wondered if this is the body preparing for inflammation or some function like that. Not sure though!
Tomas
Posted at 14:08h, 15 OctoberIt is na interesting observation. Did you see higher than average fluctuation of body water % or weight shift? I checked daily fluctuations of these metrics from Tanita scale and can see similar increase before a flu infection last year. However I also see similar fluctuations on other days of year with no association with a sickness.
Meg Fotakis
Posted at 19:02h, 23 OctoberVery informative! Thank you. Sincerely,
Meg
john wick 2
Posted at 05:44h, 13 Novemberthank you lord chords